Friday 23 March 2012

Feb Tourist Arrivals - Still Falling


Data: Foreign tourist arrivals fell 7.6% YoY in February to 997, 571: in terms of sequential change, the rise of 1.6% MoM was 1.6 standard deviations below what one normally expect in February. In terms of the the underlying momentum trend, the 6m count is once again in negative territory, for the ninth month in the last 10.  

Comment: The data has not attracted a lot of attention, probably because the months of December to February are the lowest point of the tourist season for Turkey, but still, foreign arrivals during these months fell 1.5% YoY. January and February usually account for only 6.4% of the year's total foreign tourist arrivals, but the performance so far suggests a fall of around 1% for the year.

Still, earnings from foreign tourists came to US$23.02bn last year on a balance of payments basis, which was equivalent to 16.4% of merchandise exports, and an amount equivalent to just under 30% of Turkey's total current account deficit. Last year, those earnings grew 10.6% YoY, in line with the 9.9% YoY rise in the number of foreign tourists.

The moral? The downturn over the winter doesn't matter much. But the numbers need watching: if by mid-season Europe's recession has choked off Turkey's tourism business, the job of reversing the current account deficit, narrowing the private sector savings deficit, and bolstering the internal cashflow of the economy becomes significantly more difficult.   

Tuesday 20 March 2012

Terms of Trade - A J-Curve Anomaly in January?


Of all the factors determining the state of a particular economy's business cycle, the most easily overlooked is movements in the terms of trade (ie, movement in export prices relative to import prices). Yet for an economy with a significant trading sector, time and again it proves crucial both to industrial sector profitability and to the cash flowing into or out of the financial sector from it. Turkey's merchandise exports are still only around 17.7% of GDP, but imports are 31.5% of GDP, and the principal financial determinant right now is the pace at which Turkey corrects a private sector savings deficit which burst out to around 9% of GDP last year. So we need to keep an eye on Turkey's terms of trade.

January's data shows export prices down 0.2% MoM and 0.31% YoY, whilst import prices fell 2.3% MoM but rose 2.95% YoY. The net impact of this is that Turkey's terms of trade rose 2.1% MoM, but still fell 3.3% YoY.

When reading the YoY comparisons, remember that in January, the Lira was down 15.1% YoY against the US dollar.

The good news is that although export prices fell in lira terms, the sharp collapse in momentum seen during 2Q and 3Q last year has abated. The bad news is that this abatement alone will not stop YoY comparisons becoming increasingly negative during the first half of this year, before recovering (possibly) in the second half. In sectoral terms, manufacturing export prices were up 7.2% YoY, whilst agricultural prices were up 1.1%, fishing prices were up 15.4%, and mining prices were up 13%. Within manufacturing, the highest YoY rises in prices are seen in basic metals (up 22%), food products and petroleum products (both up 14.9%). But export prices for communications equipment are down 13.5% YoY, motor vehicles are down 4.8% and machinery is up just 0.9%. Prices for textile exports are up 12.8% YoY, clothes up 7.6%.  
It is not immediately clear why Turkey's terms of trade recovered so strongly in January, reversing most of the near-collapse seen between July and October. The data tells us that the price of agricultural imports fell 6.9% YoY in January, and prices of manufactured imports was flat YoY, which was almost sufficient to offset a 21% YoY jump in prices of imports of resources (crude petroleum up 22.5% YoY, metal ores up 20.2%). However, it is difficult to miss that this improvement coincided with the depreciation of the lira.

Normally one would expect import prices to rise in the face of a depreciating national currency, whilst export prices would come under pressure from overseas customers suddenly aware of a greater room for price negotiation. In this case, the opposite seems to have happened. Assuming the data is correct, we must expect that in a few months we will be explaining the improvement of Oct-Jan terms of trade as an anomaly produced by the J-curve effect, in which the results of a currency depreciation are invisible or counter-intuitively positive in the very short term, only to be reversed in the medium term.


Thursday 15 March 2012

January Labour Markets


Data: The unemployment ratio jumped to 9.8%, up from 9.1% the previous month, sharply reversing a downward trend which has been more or less uninterrupted now since mid-2010. The urban unemployment ratio rose to 11.5% from 11%.

All of which sounds bad. And – for reasons which need perhaps more explanation that one might think – it is. However, note first that these unemployment ratios are not seasonally adjusted, and it turns out that the MoM rises in the ratio are exactly in line with usual seasonal patterns. So a seasonally adjusted series would show the unemployment ratios unchanged month on month.

The trouble is, such statistical complacency doesn't extend to the fact that the number of people in employment fell by 589,000, or by 2.4% MoM. That's a fall far worse than the 1.6% MoM fall one normally expects in this month – in fact, its a fall 1.42 Sds worse than normal seasonalized trends. The only reason why the unemployment ratios would have remained the same, seasonally adjusted, is because for some reason, the count of the labour force fell by 442,000, or 1.7% MoM – a fall that was 2.3 Sds outside Turkey's normal seasonal patterns. I have no explanation for this sudden and statistically very unusual demographic deviation.

But, as the chart shows, no matter how you finesse the stats, we still have a situation where employment growth has fallen to 4.5% YoY, and where the underlying momentum in the labour market remains negative.
There's a final but important complication/mitigation. If we look at the 589,000 monthly fall in employment, we find that it's almost wholly the work of two sectors: agriculture (down 391,000) and construction (down 172,000). In both cases, some fall in employment is expected seasonally, but in both cases this was worse than usual – is this a combination of slowing credit being exacerbated by poor weather? Meanwhile, much more importantly, there was no sign that manufacturing employment was suffering: for the first time in three months, manufacturing employment very marginally was stronger than usual seasonal patterns. In the end, we may find that the resilience of the manufacturing sector is what matters.

Tuesday 13 March 2012

Jan Manufacturing - New Orders and Turnover


  • Turkey reported manufacturing new orders up 17.4% YoY in January, with orders for capital goods up 26.9% YoY, orders for consumer durables up 26.1% YoY, intermediates up 14.7% and consumer non-durables up 12% YoY.
  • Manufacturing turnover, meanwhile, was up 15.1% YoY in January, led by a 31.1% YoY rise in consumer durables, 17.4% rise in capital goods, 13.9% rise in intermediates and 13.5% YoY rise in consumer non-durables.
Both these indicators suggest a modest by sustained recovery in momentum terms from the doldrums of mid-2011.

Although in YoY terms new orders are rising slightly more quickly than turnover, the difference is neither large nor informative. In terms of underlying momentum, both tell the same story: (new orders, January was a sequentially quite weak month, following the surprising strength in December. The six month momentum trendline for both tells us that Turkey's manufacturing sector is running very slightly above trend: if maintained, this would imply turnover growth slowing to around 20% this year, down from 27.9% last year.  
My estimate (based on depreciating all gross fixed capital formation over a 10-year period) is that Turkey's capital stock grew around 17% last year, with its growth still accelerating (as the rises in capital goods manufacturing – 26.9% YoY in turnover, and 17.4% YoY in new orders tells us). In which case, manufacturing turnover growth of around 20% doesn't leave a great deal of room for error (policy error, for example) before asset-turns begin to deteriorate, taking returns on capital with it.

Today's two data-points also do not change the industrial story for January already detailed by earlier data: industrial output up 1.6% YoY, exports up 28% YoY (in nominal lira terms), and the PMI slowing modestly to 51.7 (from 52 in December). Those indicators, together with capacity utilization, go to make up my Industrial Momentum Indicator, which shows how current conditions deviate from long-term seasonalized trends – with the deviation expressed in numbers of standard deviations. Both suggest a modest but sustained recovery from the doldrums of mid-2011.


Monday 12 March 2012

Jan Current Acct and Private Savings Flows - Still Improving


Turkey today reported that it ran a current account deficit of US$5,998mn in January, slightly down from US$6,565 mn in December, and US$6,022mn in January 2011. Nonetheless, this was taken as a disappointment (consensus had expected a deficit of only US$5,500mn for the month), because the monthly improvement was only approximately half the improvement of the trade balance. The surplus on 'invisibles' amounted to only just over US$1bn, which was 24.1% less than in January 2011. Part of the reason for this, no doubt, was the stalling of the tourism trade: tourist arrivals rose only 0.6% YoY in January – no doubt reflecting Europe's straitened economic circumstances.

The country was unable to attract sufficient net capital and financial inflows to offset the current account deficit, and ended up running a balance of payments deficit of US$2.671bn in January, smaller than the US$5.313 bn deficit in December, but nonetheless reversing the surplus of US$863mn enjoyed in January 2011, and the fifth monthly balance of payments deficit in the seven months since July 2011.

So far so gloomy. However, what matters for Turkish financial markets right now is the extent to which, and the pace at which, it winds back the private sector savings deficit which ballooned to around 9% of GDP last year. Movements in the current account are a crucial part of this calculation, and here the news is distinctly better.

In nominal terms, the 3m private sector savings deficit hit bottom in May 2011 at Tkl 33.99bn, and has since moderated. That progress was continued during January. In the three months to end-Jan, the PSSD improved to Tkl 26.57bn – only Tkl 2.38bn above where the balance was the same period last year.


Private sector savings surpluses and deficits usually have a distinctive seasonal pattern (as do current account balances, and government fiscal balances) so we can also assess how current changes in private sector savings flows compare to 'normal' conditions. And, as the second chart shows, when judged on this basis, Turkey's private sector savings cashflow position continues to improve, with the pace of improvement having picked up noticeably in the three months to both December and January. 

Friday 9 March 2012

Housing Prices - Dec 2011

Turkey's central bank has reported housing price data for December, which showed national house prices up 0.9% MoM and up 11.3% YoY, whilst prices in Istanbul were up 1.4% MoM and 13.3% YoY. For newly built housing, prices were up 0.7% MoM and 10.3% YoY. For all the indexes except Istanbul the  MoM rises have clearly slowed from the levels seen during the first half of 2011, but none of them are showing significant signs of real pressure.

This matters for Turkey's banks, since loans to households account for 37.8% of total banking loans, and of those, exactly a third are housing loans.  But this proportion peaked during 1Q11 at 34.3% and has been falling since. So, by December, loans to households were growing by 29% YoY, but housing loans had risen only 21.2%. In fact, the sequential momentum of housing lending has been leaking away consistently since August, and by December the 6m momentum trendline was negative 0.21SDs - its first negative reading since 2009.

Clearly one would expect the housing loans momentum measure to be an early indicator for housing prices, so should expect to see negative pressure emerge over the coming year. 

One Day the EU Will Apply to Join Turkey


I've spent the last couple of months an investment bank in Bahrain which had (past tense) an ambition to ally the surplus capital of the Gulf region to the financing opportunities presented by the historic emergence of Turkey and its near neighbours. To my mind, that was (and is) a hugely inviting prospect. Istanbul is one of the few cities that can claim to be the centre of the world, and right now hosts an alliance of demographics and growth that I remember from the great Asian emerging markets of 20 years ago. The long and short of it is that Turkey is a country of 74+mn, with a median age of 28.5 years, a per capita income averaging around US$10,300. Over the last decade its real GDP growth rate has averaged 5.3%, but it's been a rough old journey, with a standard deviation of 4.4%.

Growth, opportunity and volatility – what's not to like for an emerging market investor?

Right now, it looks as if 2012 will be another rocky year, with investors needing to take a view on how far Turkey overheated last year, how quickly it is rebalancing its economy between domestic demand and exports, and how much appetite world markets have to keep financing Turkey's investment spending. My sort of questions, in other words. (Incidentally, I expect the usual suspects will markedly underestimate the capital appetite for Turkish risk at this point: the key datapoint being the 110% jump in FDI – the world's stickiest money – last year).

My starting point is, as usual, to run the Flow Essentials charts to get to the underlying ratios Turkey's economic growth and financing depends on. Start with estimated growth of capital stock and the direction of ROC. My assumption is that when you've got a rapidly expanding banking system (loan growth of 42.3% last year) you must have significant misallocation of resources, disguised temporarily by inflation (up 6.5% on average in 2011, and rising sharply, to 10.6% YoY in January). But even using deflated numbers, on my count capital stock is growing around 8.6% pa (or 16.5% nominal), but ROC was no worse than flat last year.
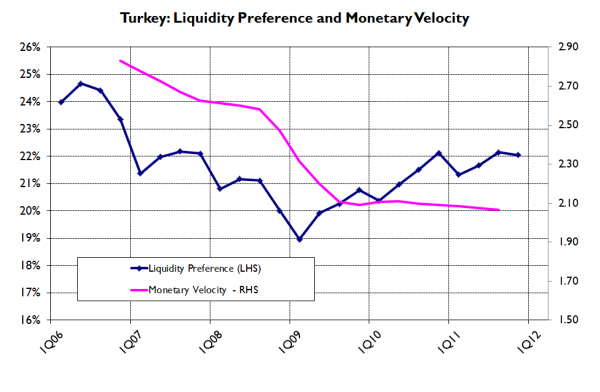
And this was borne out by the monetary velocity reading, which again was no worse than flat.
This was a genuine surprise: the expected misallocation should have shown up far more starkly on these charts.

Still, leverage must have been rising sharply, and banking data tells us that banks' loan/deposit ratio rose from around 80% at the beginning of the year to 89% by the end of the year, and that this had been financed at least in part by an increase in foreign liabilities from a net US$16.74bn at the beginning of the year to around US$20.4bn by the end of the year. But once again, one would have expected the rise in leverage of the banking system, and is escalating exposure to the jitters of its foreign liabilities to be more extreme. Run the numbers, and it turns out that only 9% of the rise in the loan book was funded by the net increase in foreign liabilities – slightly less than the 11.2% that was funded by banks' running down their holdings of domestic securities.

But in the end, we cannot escape the fact that even if Turkey's rapid 2011 growth has been driven by rather less inefficient resource allocation than we had expected, and even if the financing of the growth was rather less reckless than it might have been, Turkey's growth was still powered by a major private sector savings deficit. In fact, I estimate that that deficit came to 9.3% of GDP in 2011.
And here is the rub: judging how far and how fast that savings deficit is being corrected this year is surely the key to potentially one of the most exciting turnaround stories of the year. More, much more, to follow. . . .